


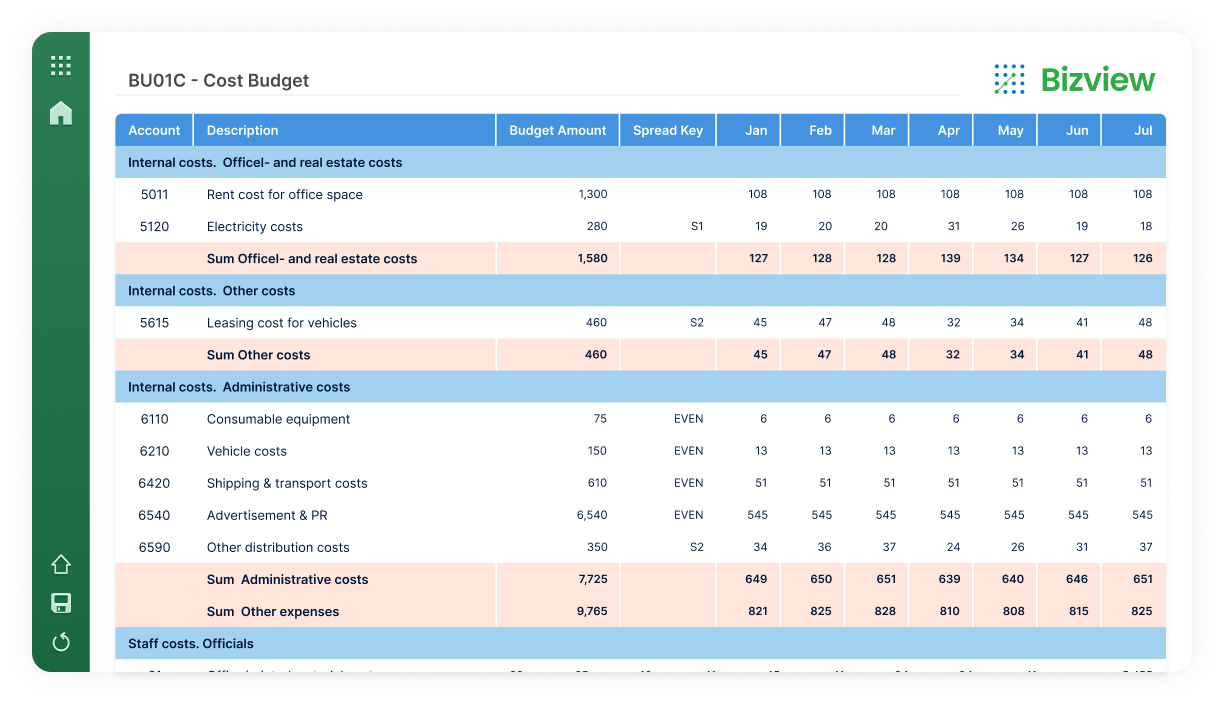
Web-based budgeting, planning & forecasting
Budgeting & Planning: Bizview is an integrated and scalable web-based budgeting, planning, and forecasting solution.


Based on980+reviews
With CXO, the commentary is an integral part of the data model. So, we can go back a year and see the discussion we had…

Based on980+reviews
The time CXO saved us is definitely days, not hours, off the monthly reporting cycle.

Products
Budgeting & Planning: Bizview is an integrated and scalable web-based budgeting, planning, and forecasting solution.
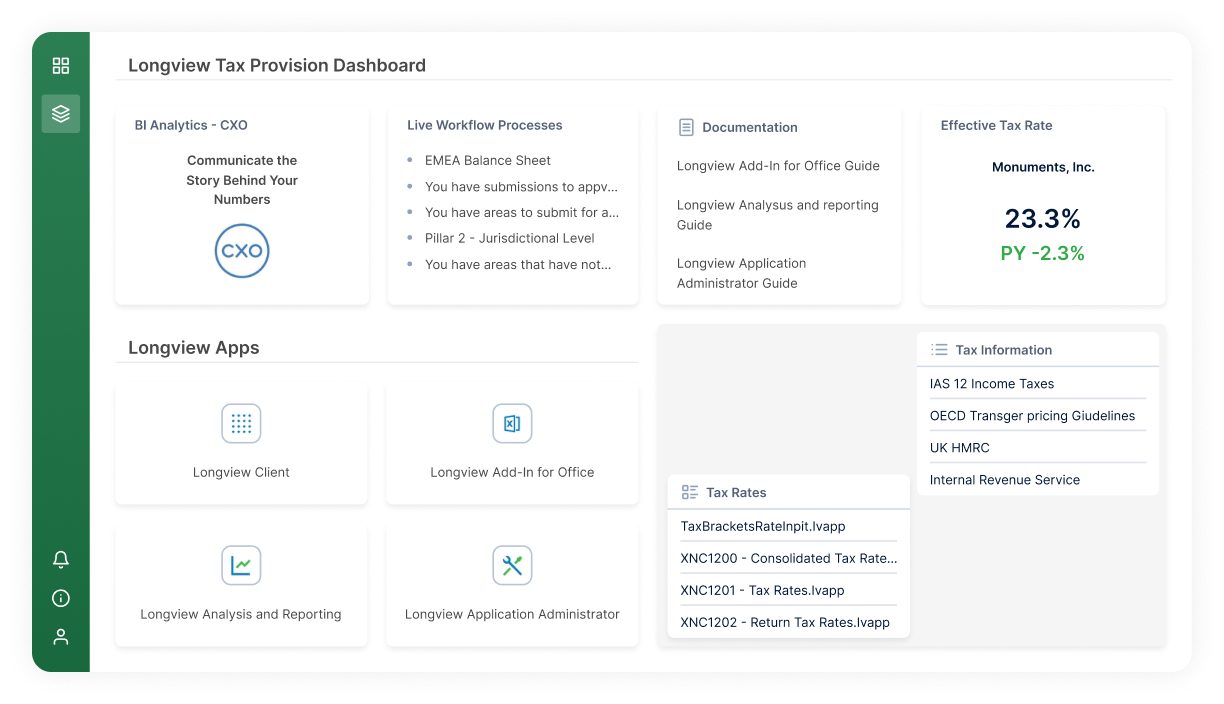
Longview Tax enables more frequent reporting, better tax forecasting, and faster responses to ad-hoc queries improving visibility and governance.
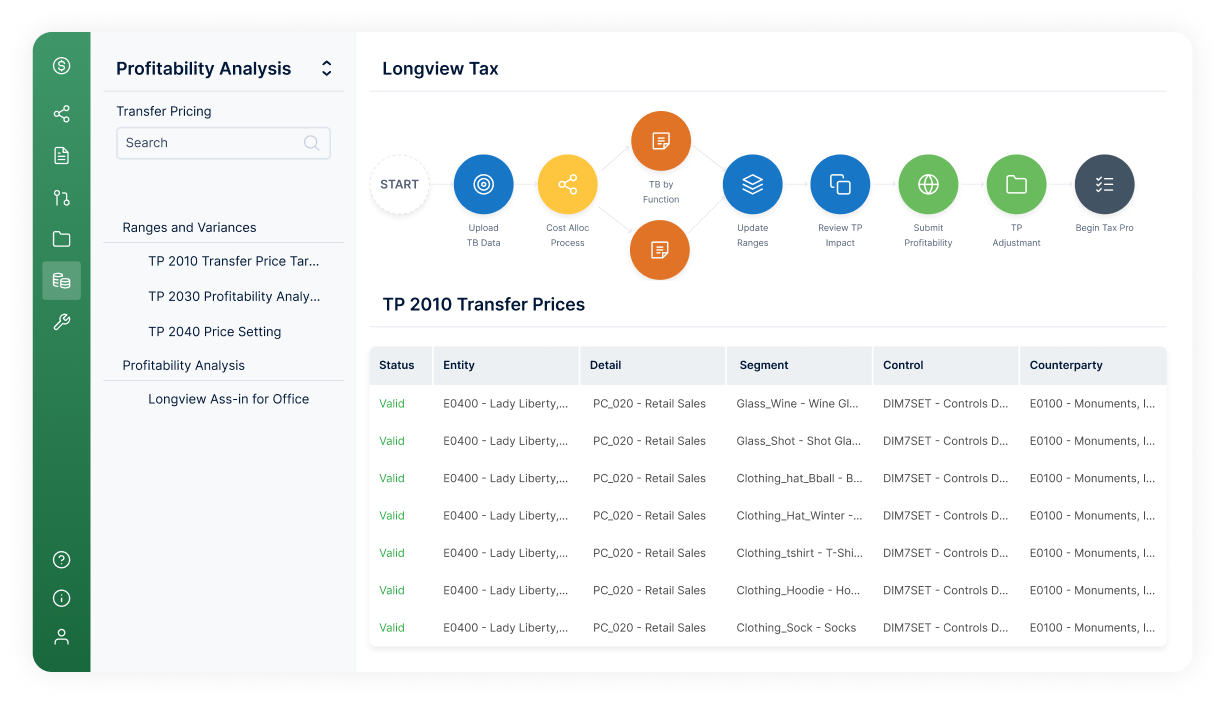
Longview Transfer Pricing connects your enterprise strategy and tax policy with transfer pricing execution, enabling modernization with lower risk.
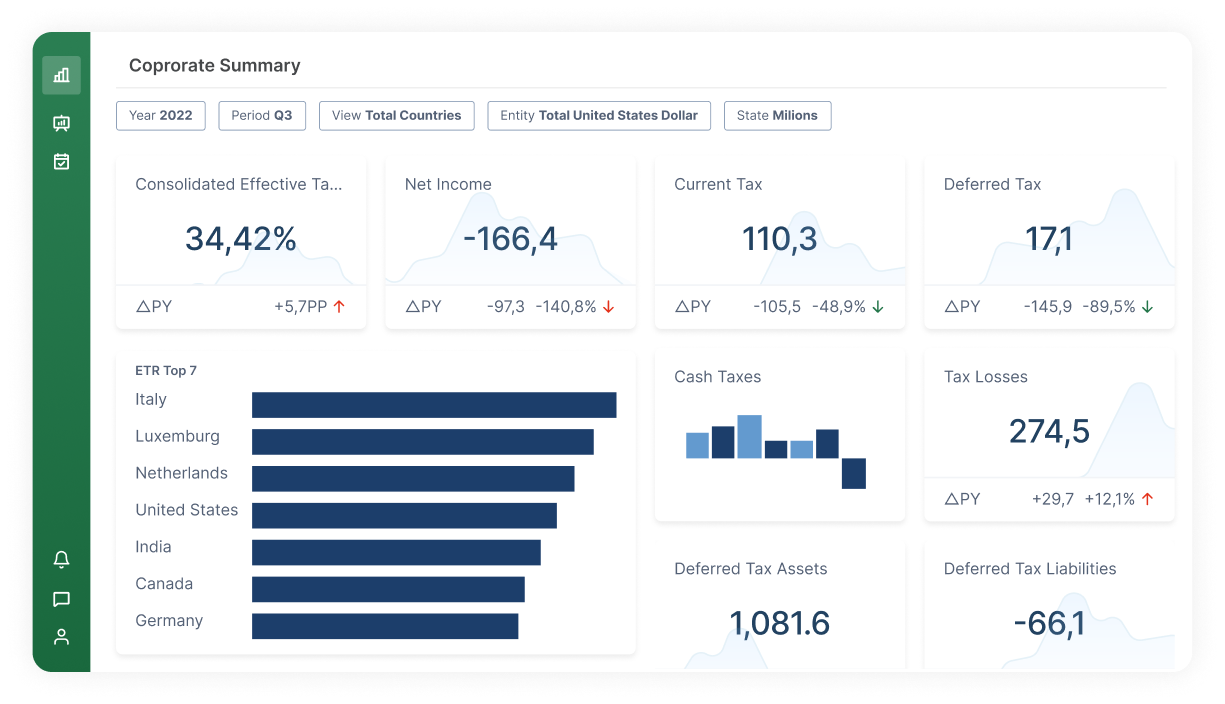
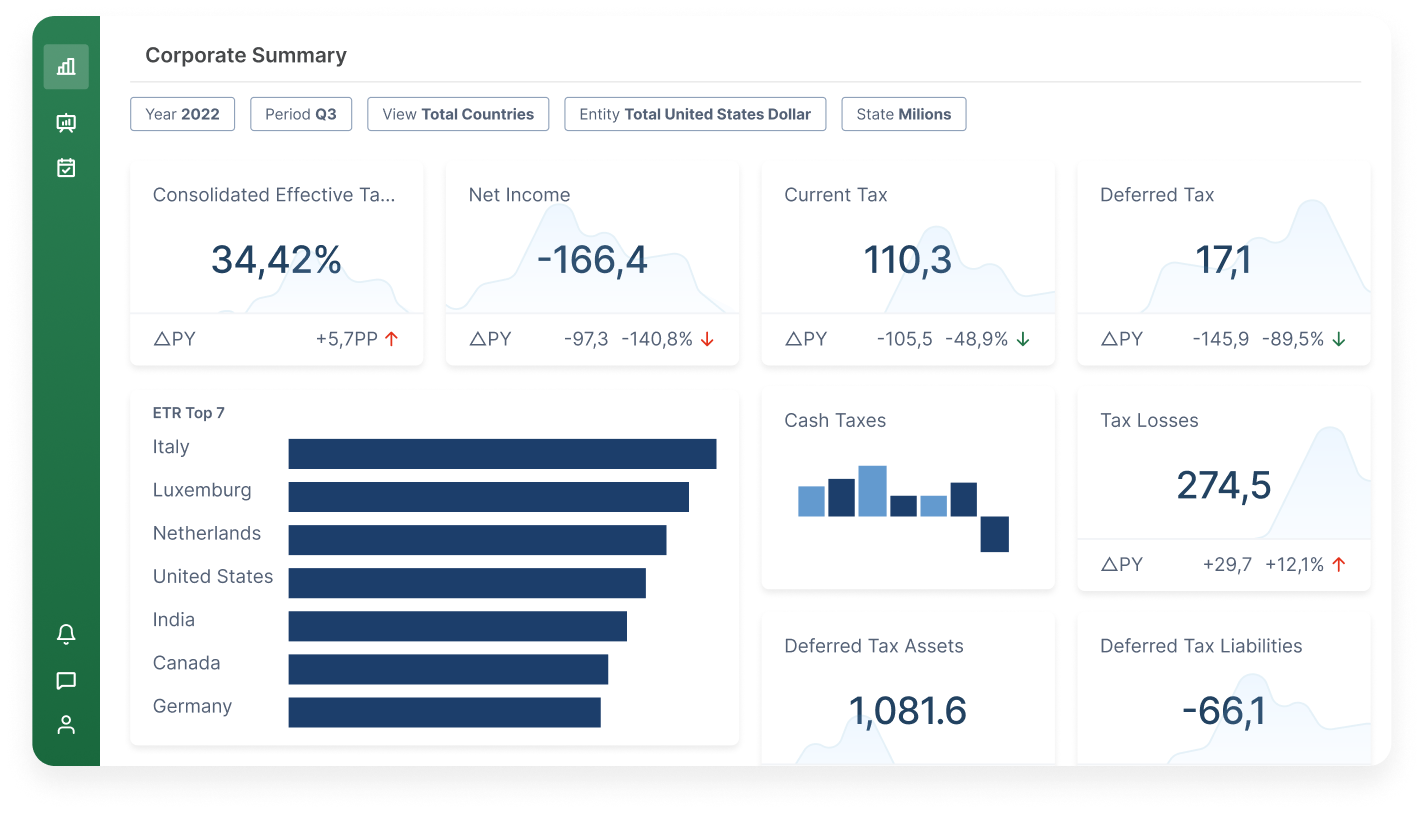
CXO offers web-based reporting for OLAP cubes. Connectivity with all market leading EPM solutions, enables users to create digital reports and dashboards.
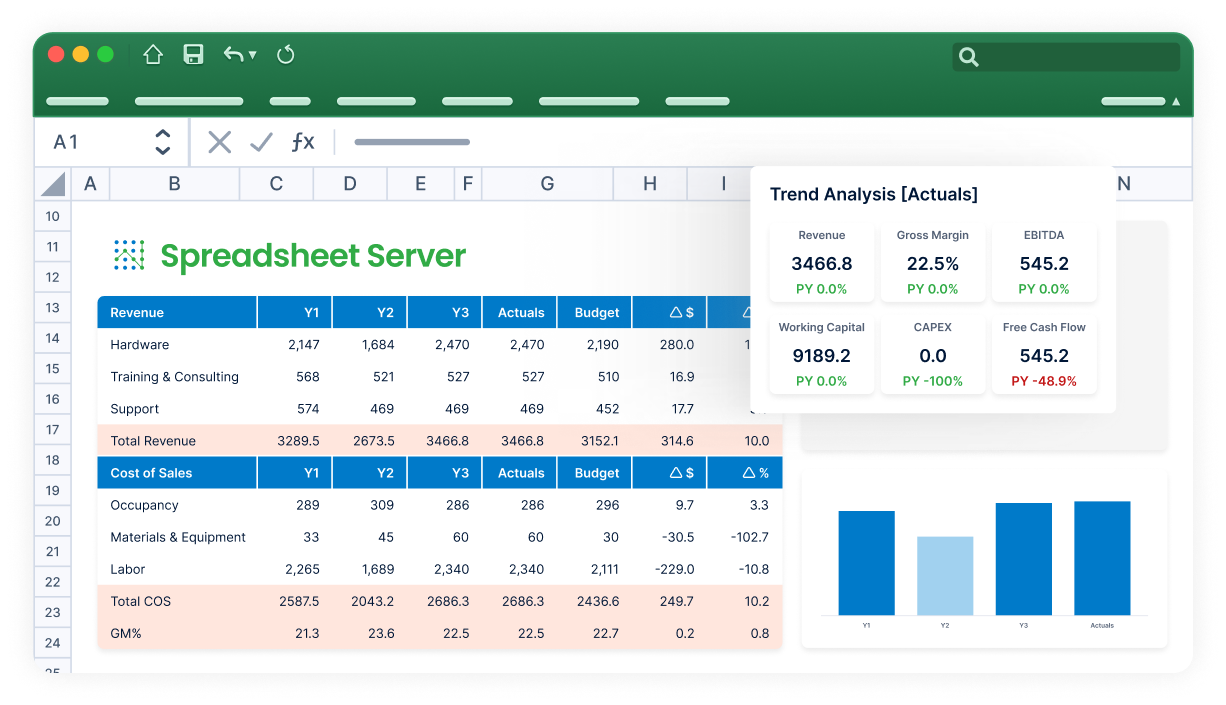
Spreadsheet Server is easy to install and delivers fast time to value. It automates custom reports with drill-down to transactional data.
Relying on IT for report creation and management often leads to frustrating delays that hinder productivity and slow decision-making. These inefficiencies can disrupt your workflow, making it clear that a faster, more efficient solution is essential.

Non-finance users, like C-level executives and departmental managers, often need visually engaging representations to make data more accessible and actionable. Unlike finance teams who rely on rows and columns of numbers, they depend on visuals to drive clarity and decisions.
Manually exporting data from Tagetik into Excel, reformatting it to fit your reporting needs, and repeating this tiresome process every month is a drain on your time and efficiency. A streamlined, automated solution could free up valuable resources.
Use Cases
Take control of your reporting with intuitive, finance-owned software designed to seamlessly integrate with your Tagetik analytics cubes. Effortlessly create and share dynamic, web-based, and mobile dashboards tailored to finance data. These dashboards offer powerful tools like filtering by various points-of-view and drill-down capabilities for deeper analysis. Additionally, you can combine data from multiple sources to deliver a thorough, big-picture understanding of your organization’s performance. Empower your team with a streamlined solution that simplifies reporting and enhances decision-making across the board.
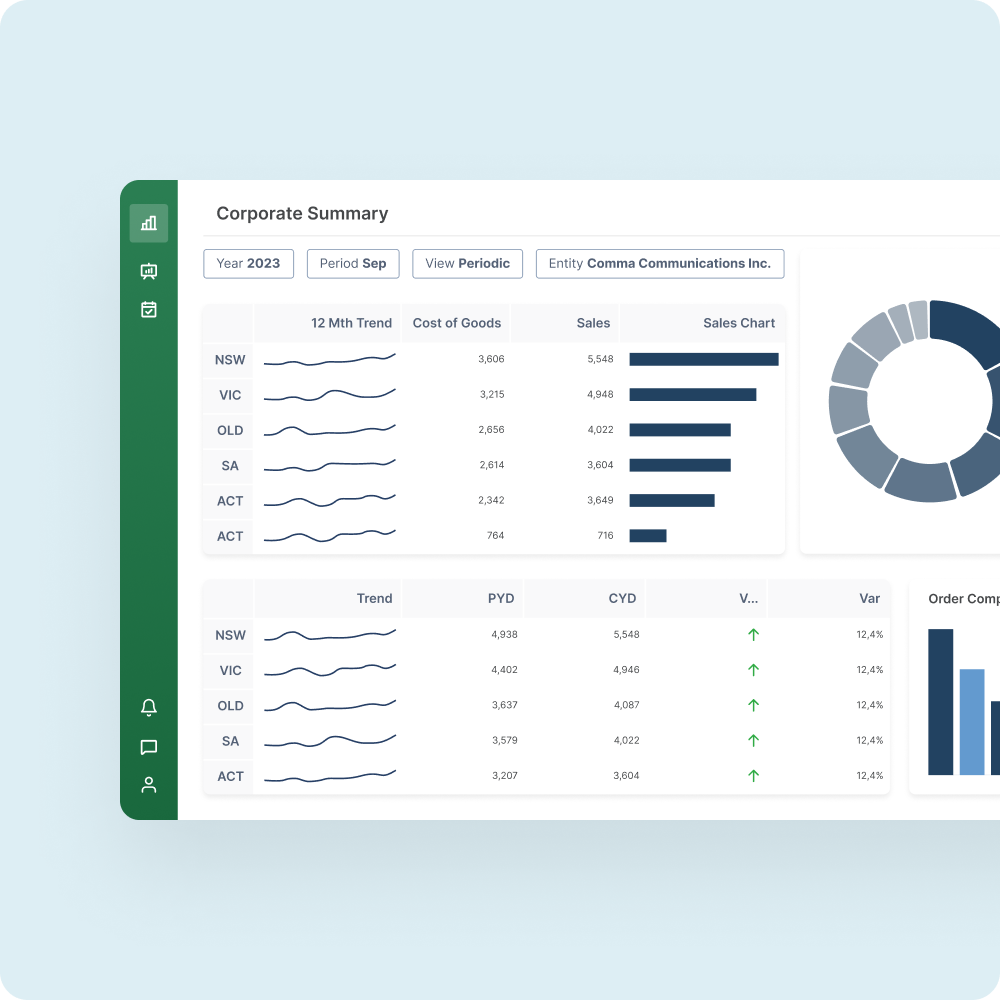
Bring your Tagetik data to life with rich, interactive visualizations. Create and share flexible reports and dashboards featuring custom drill downs and guided navigation to provide executives with fast answers to critical questions. Add commentary and enable collaboration to enhance decision-making, while easy color coding highlights variances at a glance. Accessible from desktop browsers and mobile devices, these tools empower your team to work efficiently, ensuring data clarity and actionable insights no matter where they are.
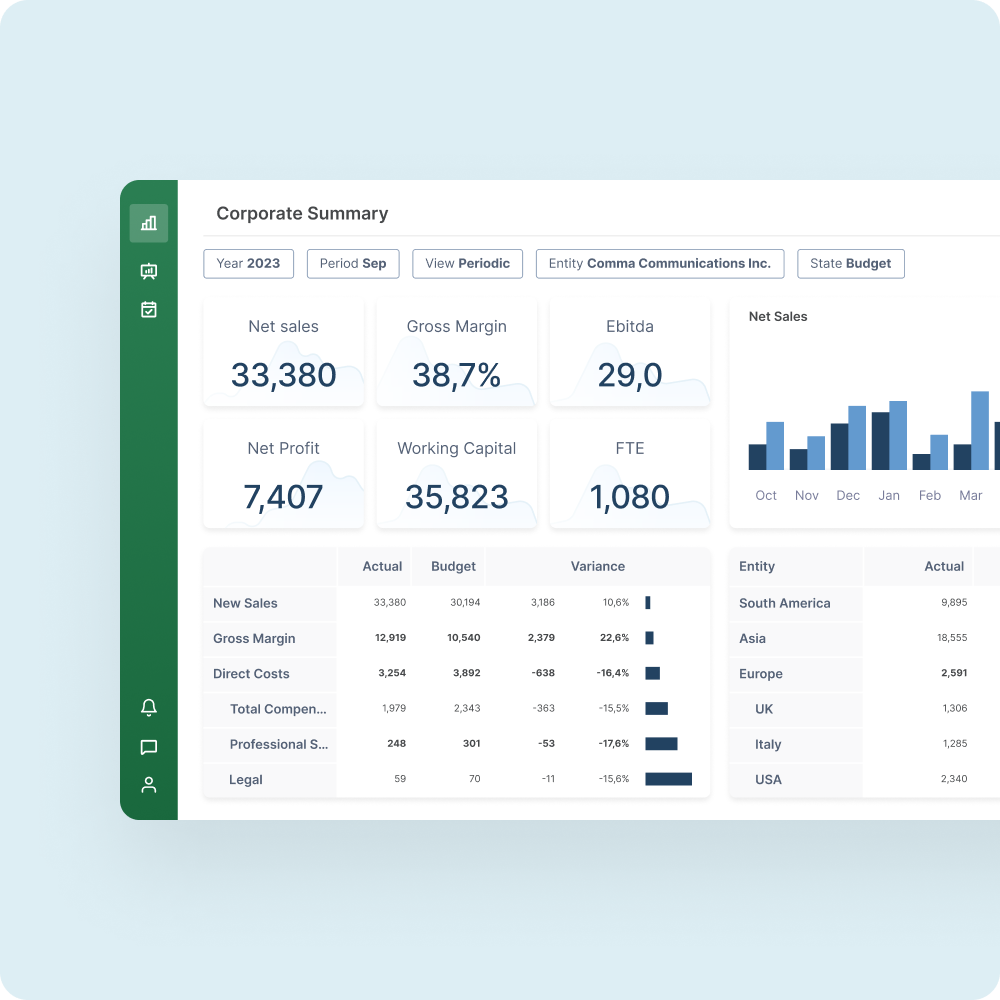
Turn static PDFs and printouts into modern, dynamic storyboards that captivate and inform. Tailored for C-level executives, these storyboards present data in their preferred format and guide them to critical answers. Capture departmental insights with comments explaining variances and seamlessly consolidate this information for executive-level reporting. These engaging tools empower leadership to make informed, data-driven decisions while fostering collaboration across teams, transforming traditional board packs into powerful storytelling platforms that drive clarity and action.
With a saturated market full of solutions to choose from, you need to have a clear understanding of your data needs before you start comparing your options. In this white paper, you will learn:
What to look for in reporting and/or BI software.
Why a reporting and BI solution is essential for growth
How to avoid reporting and BI solution implementation failure

Read and watch the latest resources for finance and operations professionals looking to get inspiration on how to improve their processes.


Blog
Master the skill of financial storytelling and learn how to transform complex financial data into impactful narratives.
Read More