Sales Dashboard II
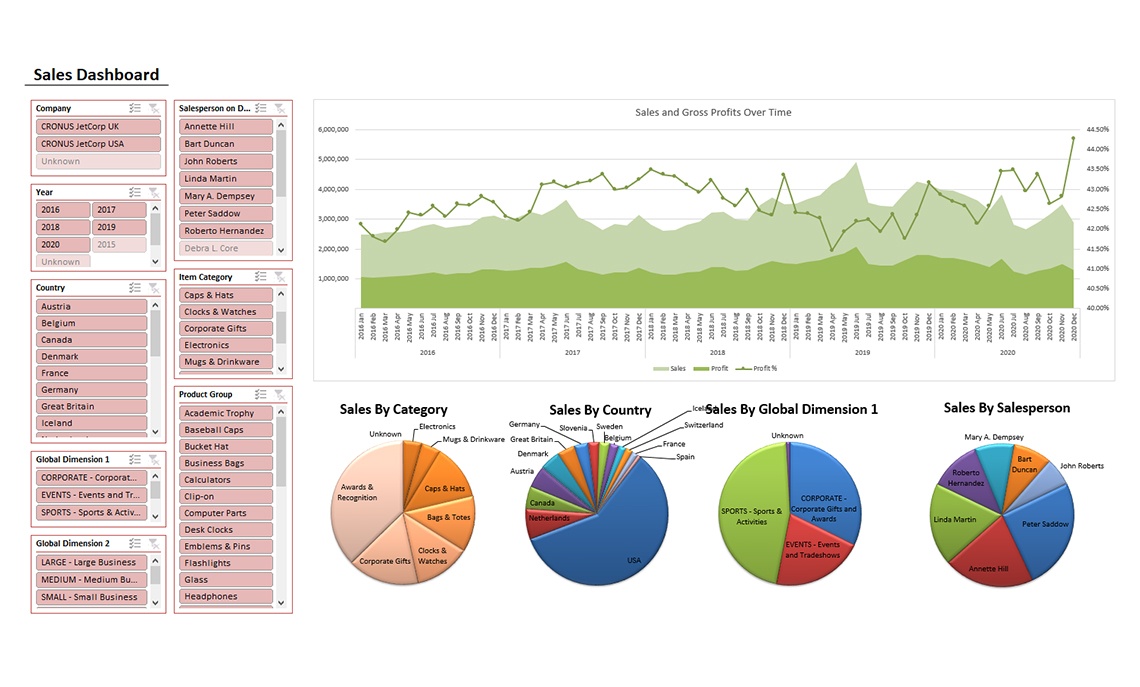
Dashboard view of an organization’s sales over time. Slicers can be used to filter data and graphs by company, year, salesperson, item category, product group, country, global dimension 1 or 2.

Dashboard view of an organization’s sales over time. Slicers can be used to filter data and graphs by company, year, salesperson, item category, product group, country, global dimension 1 or 2.