
Planering och affärsintelligens


Extend Qlik Instantly & Give Users the Self-Service Tools They Need
Vizlib is the most flexible suite of Qlik Sense extensions and enhancements for advanced data writeback and building custom interactive reports. Explore, edit, and collaborate, all from within Qlik Sense’s interface — without compromising security or workflows. Trusted by global customers and now part of insightsoftware’s business intelligence offerings.
Se själv varför över 500 000 användare använder insightsoftware för att få omedelbara insikter ur data, reagera snabbt på förändringar på marknaden och ligga steget före konkurrenterna


Baserat på980+recensioner
”KPI Designer är vår främsta Vizlib-produkt hos Novartis, inom hela Vizlib-biblioteket. Det är som natt och dag jämfört med det inbyggda KPI-objektet.”

Baserat på980+recensioner
Vizlib Library is an amazing product and enhancement. I’m really enjoying the features like the Viztips – the little details that make our reports better…

Baserat på980+recensioner
The customer service is really good. We are really happy with that. When we have a problem, we know we can always address it. Plus,…

Stop Waiting Weeks for the Dashboards You Need
Business Teams Stuck Waiting for IT Help
You need specific visualizations Qlik doesn't offer—Gantt charts, financial reports, custom KPIs. But your BI team is buried in requests. So you wait weeks for dashboards, then more weeks for updates. Or you export to Excel and lose real-time data.
Your Filtered Views Hide Critical Insights
Dashboard filters show what you're looking for but hide everything else. You miss patterns, anomalies, and opportunities because you can't see beyond your current view. Without the full picture, you're making decisions with incomplete information.

Can't Update Data Where You Need To
Found an error in your forecast? Need to add context to an anomaly? You have to track down the source system, make changes there, wait for the next data refresh, then check if it worked. Meanwhile, your team works from incorrect or outdated data.
Användningsfall
Build Exactly What You Need When You Need It
Build Your Own Dashboards in Minutes, Not Weeks
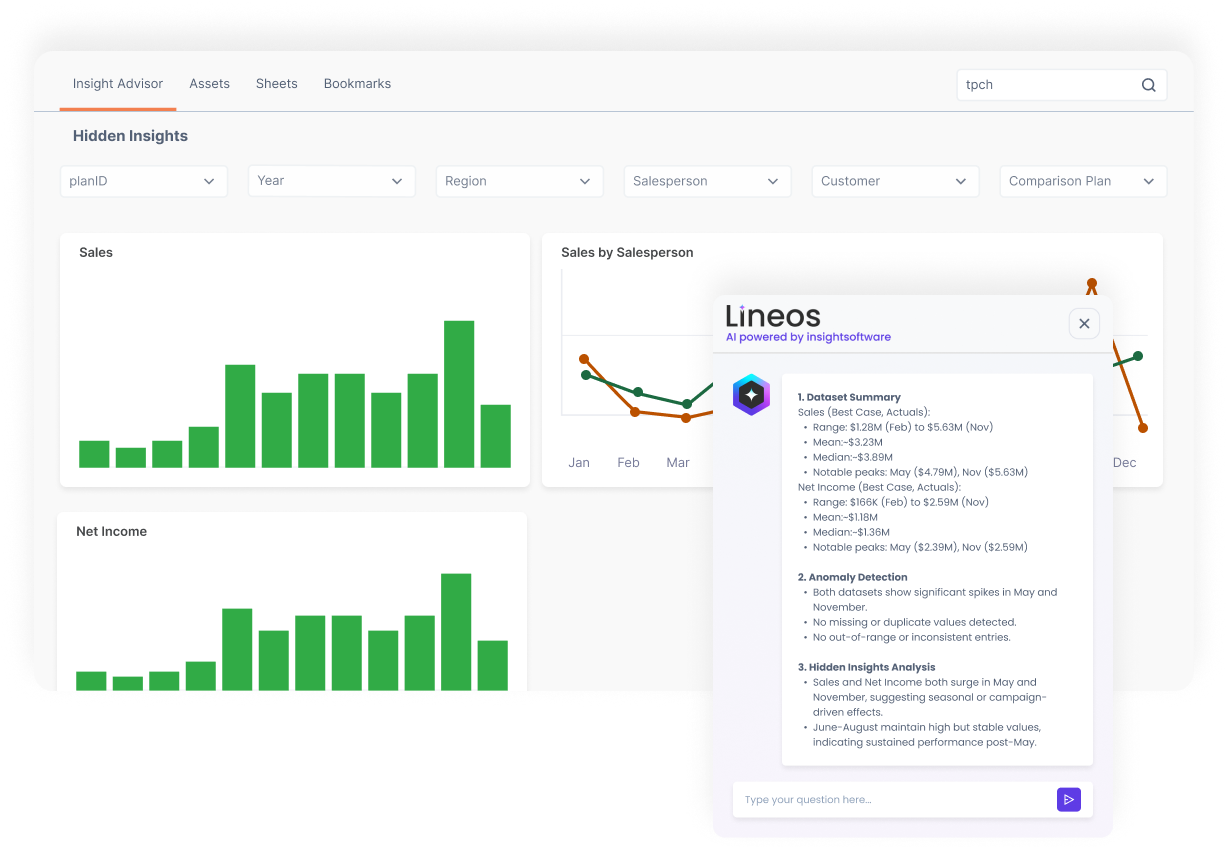
Drag and drop data fields, apply filters, and create visualizations using familiar Excel-like functions. No coding required, no waiting for IT. Business users become self-sufficient analysts who can modify dashboards as needed. Hidden Insights AI pulls out trends and anomalies you might miss, explaining them in plain language. Share with one click, export when needed, and iterate based on feedback—all without technical help. Your BI team escapes the endless request queue and focuses on strategic initiatives that move the business forward.
Get 40+ Visualization Types Qlik Doesn't Provide
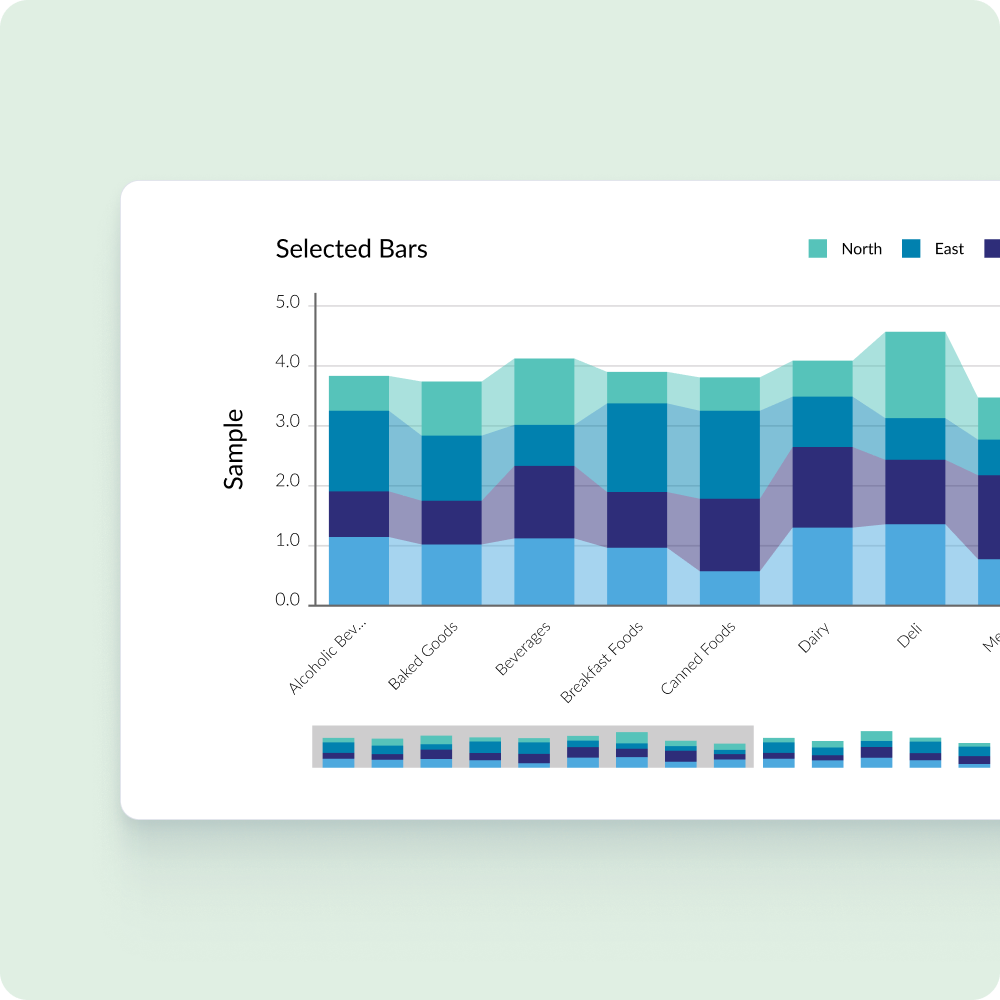
Access 40+ chart types ready to use—from Gantt charts to Sankey diagrams to custom KPI tiles. Drag, drop, and configure without writing code. Optimize visualizations for your specific business use cases. Save templates for reuse, ensuring consistent, professional dashboards across your organization. AI-powered chart summaries instantly explain what your visualizations mean, helping everyone understand complex patterns at a glance. Stop settling for basic bar charts when you need specialized views. Get the exact visualization for your data story.
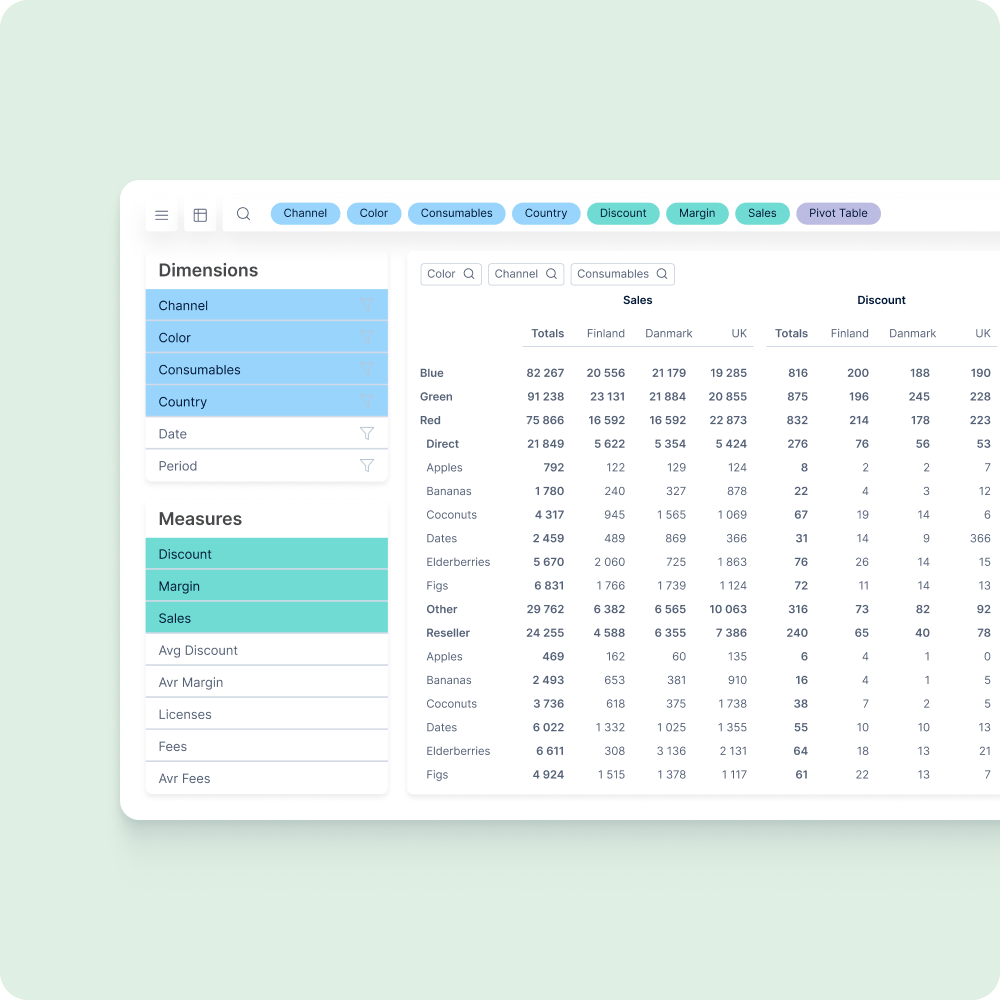
Make Your Dashboards Collaborative Workspaces
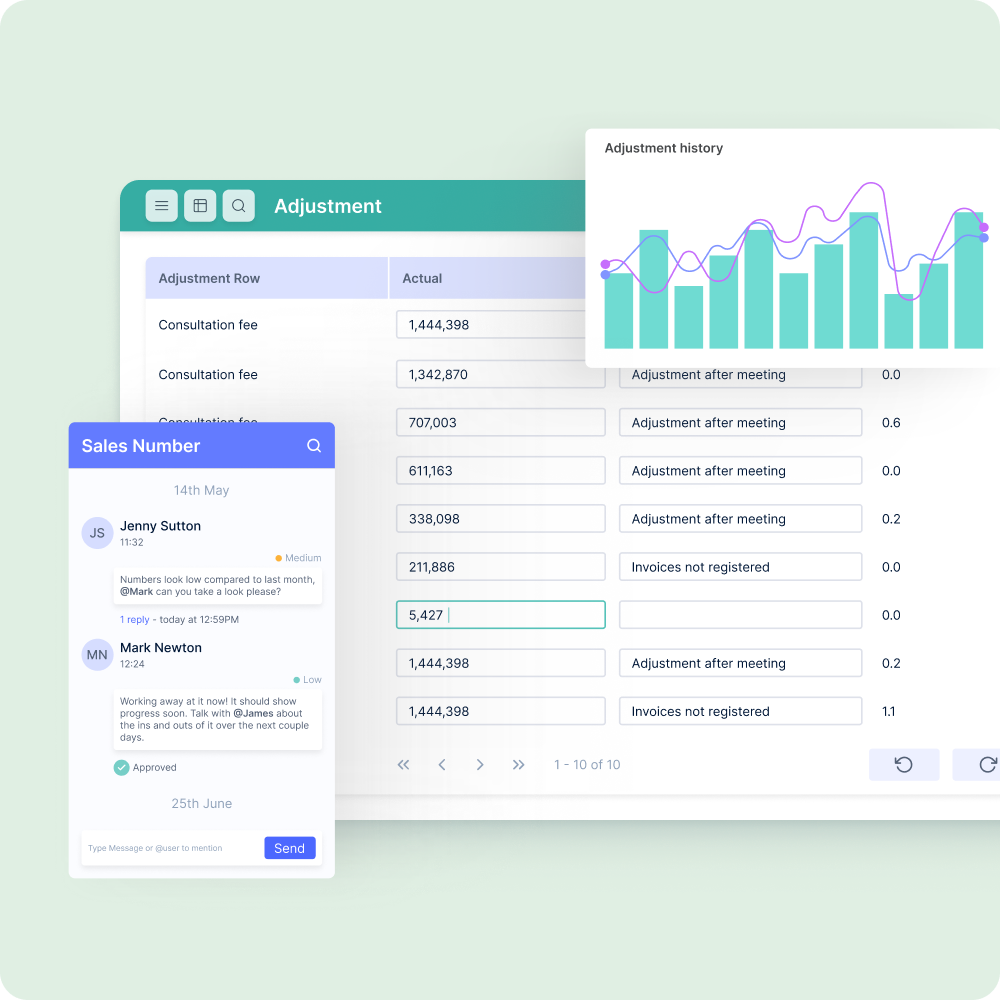
Add comments directly on data points to explain variances or flag issues. Tag colleagues for input on anomalies. Track who changed what and when with full audit trails. Update data right in the dashboard—changes flow back to source systems automatically, keeping numbers accurate. Hidden Insights AI provides insights everyone can see and discuss, ensuring teams align on what the data means. No more Excel exports, email chains comparing versions, or meetings to debate the numbers. Your entire team works from one source of truth with full context.
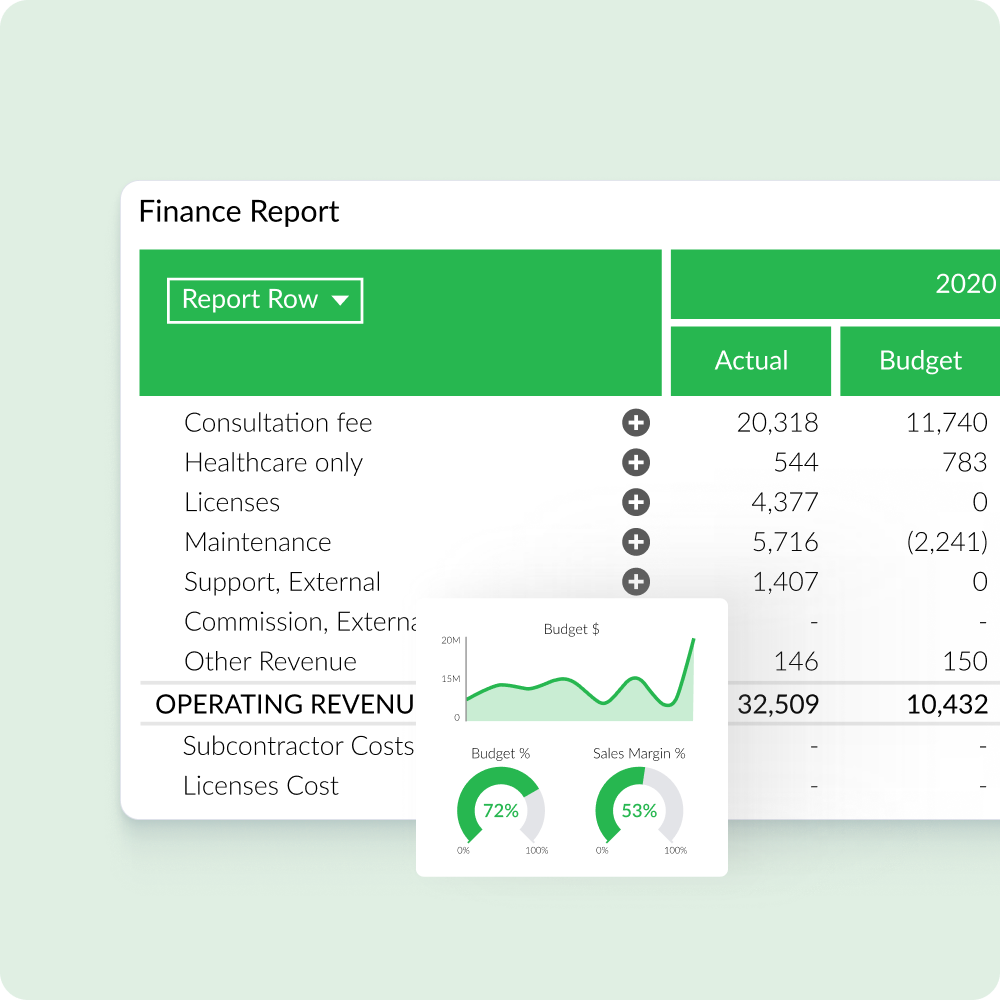
Easily Create Financial Reports Inside Qlik
Handle complex hierarchies, ragged structures, and consolidations natively—no more wrestling with Qlik's limitations for financial data. Build P&L statements, balance sheets, and variance analysis that finance teams can use. Add commentary directly in reports for month-end explanations. Update budgets and forecasts in real-time with write-back capabilities. Export board-ready PDFs that maintain perfect formatting. Your finance team stops fighting with IT about report layouts and gets pixel-perfect financial statements that match your exact needs.
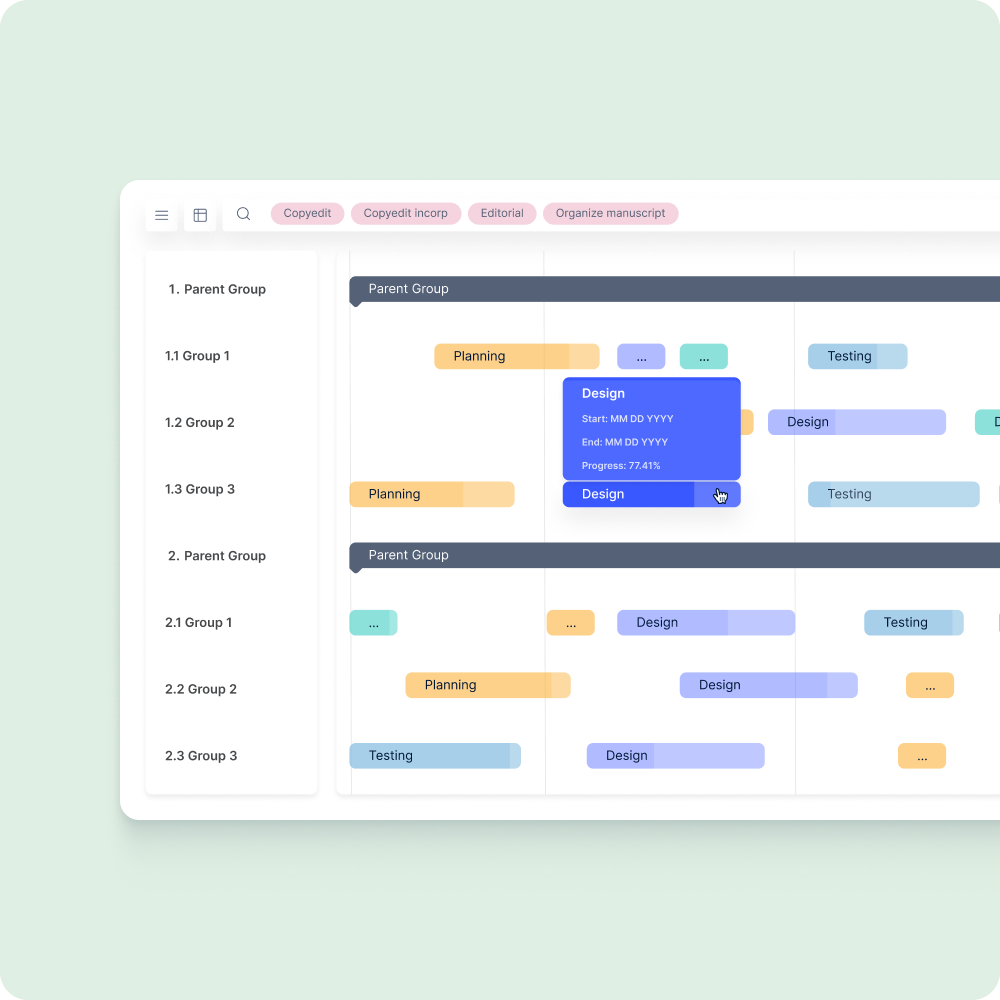
Track Projects Where Your Data Already Lives
Visualize timelines, dependencies, and resource allocation directly in Qlik dashboards. No more disconnected project data in spreadsheets while your actuals live in Qlik. Update project status and spot bottlenecks instantly. Keep project data connected to broader business metrics. See how delays impact revenue, how resource changes affect costs, and which projects move the needle. Perfect for manufacturing schedules, construction timelines, or any operation where you need to see what's happening when—and understand the business impact immediately.
Hidden Insights AI Reveals More
Stop exporting to Excel for answers. Ask Hidden Insights AI anything about your Qlik charts to instantly understand what your data means, compare charts across any timeframe, and discover opportunities hidden by your filters. No waiting for developers-just immediate insights from the data you already have.
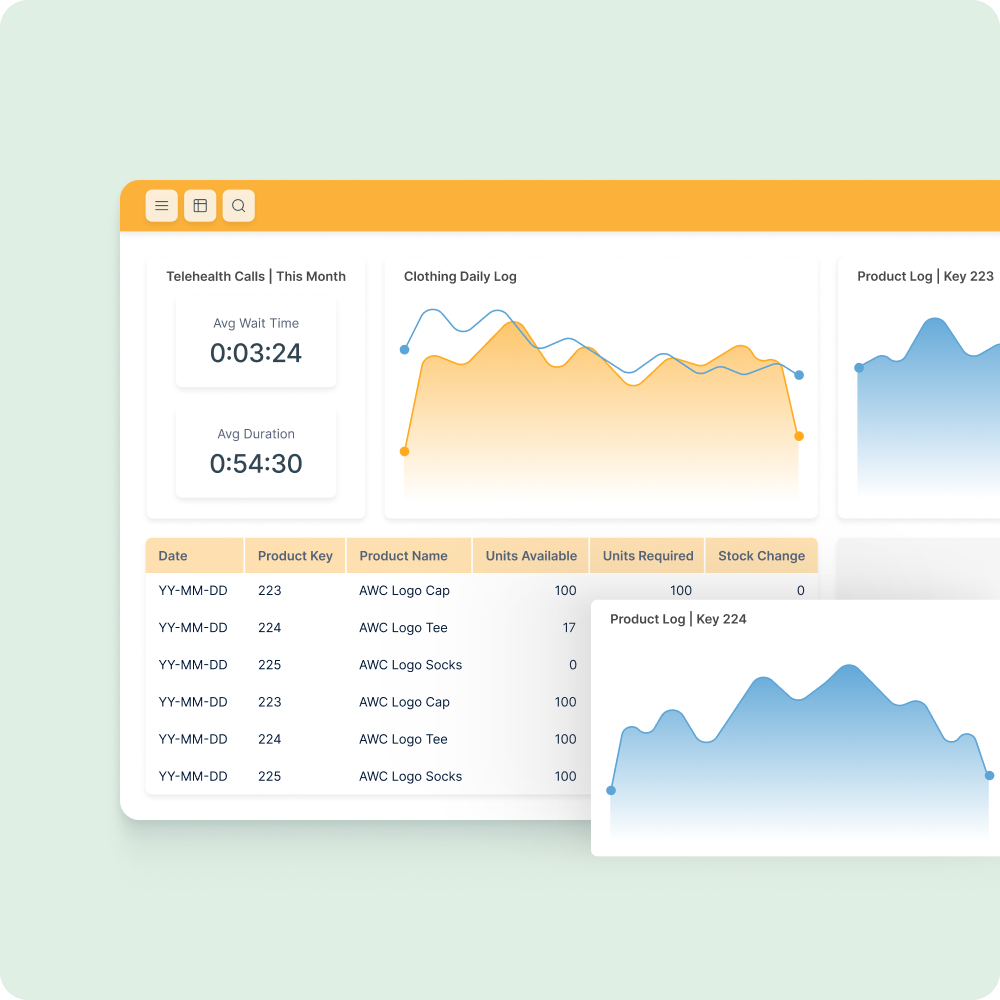
Seamless Integration With Your ERP/EPM, Realtime Data Feed & IT-Free Export Features
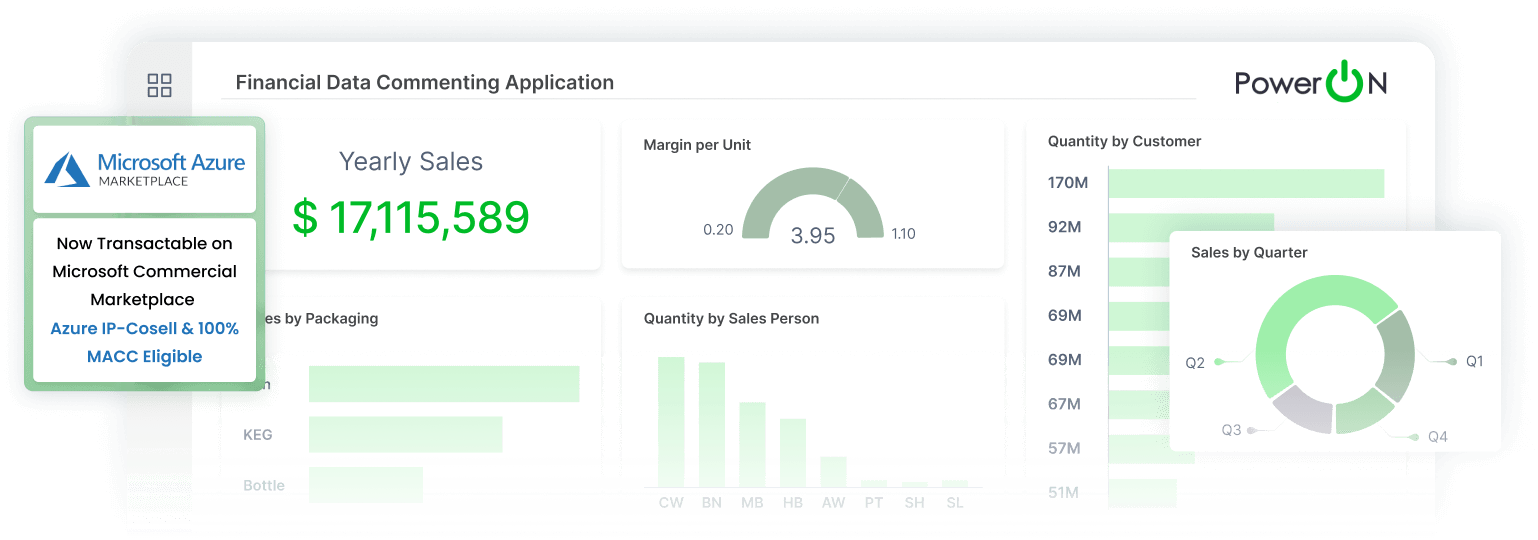
Anslut till över 140 ERP- och EPM-system, exportera och visa data utan IT-kunskaper












See How Premier League Transforms
Data Into Wins With Vizlib
Vizlib & Qlik Advanced Reporting FAQs
What is Qlik Sense?
How can I create a dashboard in Qlik Sense?
How does Qlik Sense compare vs. Power BI?
What are the cons/disadvantages of Qlik Sense?
What’s the best way to upgrade Qlik Sense?
How does Vizlib compare with built-in Qlik Sense charts?
Does Vizlib include writeback?
Can Vizlib create heatmaps?
Learn more about using heatmaps in your Qlik Sense dashboards here.
What other advanced visualizations does Vizlib include?
Learn more about Vizlib’s Mekko charts, filters, and Calendar visualizations.

