How to Build a Free Cash Flow Dashboard, with Downloadable Template

insightsoftware est le fournisseur le plus complet de solutions destinées au service du directeur financier. Nous transformons les informations en connaissances, permettant ainsi aux dirigeants d'entreprise de piloter leur organisation de manière stratégique.
Hundreds of different performance indicators exist, but fewer than 20 are considered absolutely essential. They have that designation because companies have discovered a direct correlation between the trajectory of these metrics and their own success or failure. To put it plainly, companies can't understand how well they're actually doing without tracking key performance indicators.
Free cash flow is one of the most important. Like all true KPIs, free cash flow doesn't obfuscate the issues. Quite the opposite, in fact. The free cash flow metric focuses on one crucial aspect of finance that has an outsized impact on a company's strategic agenda. Therefore, companies must track this metric carefully and frequently.
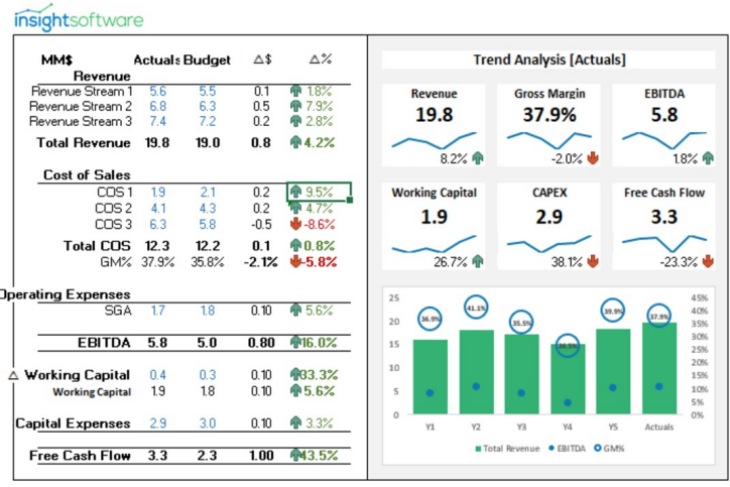
Our team at insightsoftware has created a free downloadable template illustrating what a best-in-class dashboard looks like. Spend some time exploring the dashboard to discover how easy it is to track free cash flow and how much decision making improves as a result. Before you dive in, however, learn more about the free cash flow metric, where it comes from, and what it means for forward-thinking leaders.
What is a Cash Flow Dashboard
A cash flow dashboard is a tool that provides real-time insights into a company’s cash inflows and outflows, allowing finance teams to monitor liquidity and streamline cash flow management. With a dashboard specifically focused on cash flow, businesses can easily track their financial health, identify trends, and assess both short-term and long-term cash positions. This centralized view simplifies the complex task of cash management, supporting industries with unique needs, such as cash flow management for pharma, and empowering companies to stay proactive in their financial planning.
How Cash Flow Dashboards Work
Cash flow dashboards work by consolidating data from various financial sources, such as bank accounts, sales records, and expense accounts, into a single, easy-to-understand interface. Using real-time data, these dashboards provide visual indicators of cash flow performance, including charts, graphs, and key performance metrics. Automated updates ensure that finance teams always have the latest information, while customizable features allow users to tailor the dashboard to focus on specific cash flow components. By simplifying data interpretation, cash flow dashboards help finance teams stay on top of liquidity management.
Why Cash Flow Dashboards are Important
For companies of all sizes, maintaining positive cash flow is critical to sustaining operations and achieving growth. A cash flow dashboard is vital as it offers a clear, up-to-date view of financial health, making it easier to forecast cash needs and plan for future expenses. By visualizing cash inflows and outflows in one place, these dashboards help finance teams avoid cash shortages, reduce unnecessary spending, and ensure that funds are available for essential business activities. This visibility is crucial for making timely financial decisions that align with strategic goals.
Key Components of a Cash Flow Dashboard
To be effective, a cash flow dashboard must include essential components that provide a comprehensive view of liquidity and cash management. These components combine to create a powerful tool that helps finance teams track, analyze, and forecast cash flow, allowing for more strategic financial planning and decision-making.
Real-Time Cash Balances: Displays current cash on hand from various bank accounts and sources.
Cash Inflows and Outflows: Provides a breakdown of revenue streams and expenses over a specific period.
Forecasting Tools: Allows for projections of future cash positions based on historical data and anticipated trends.
Visual Data Representations: Uses graphs and charts to simplify the analysis of cash flow trends and patterns.
Alerts and Notifications: Sends alerts for low cash balances or other key events, helping finance teams act proactively.
These components provide a comprehensive view of cash flow, ensuring that all aspects of liquidity are covered.
Benefits of a Cash Flow Dashboard
Implementing a cash flow dashboard can revolutionize financial management within an organization. By consolidating key metrics and offering real-time insights, a cash flow dashboard enhances various aspects of decision-making and resource management. The following benefits underscore the importance of this tool for maintaining financial health and driving operational efficiency.
Enhanced Financial Visibility: Provides real-time insights into cash positions, enabling better financial planning.
Improved Decision-Making: Supports timely decisions by delivering accurate data on cash availability and forecasts.
Streamlined Reporting: Reduces the need for manual financial reporting, saving time and resources.
Risk Mitigation: Helps identify potential cash flow issues early, reducing the risk of unexpected shortfalls.
Resource Optimization: Assists in efficient resource allocation by showing where cash can be best utilized.
Examples of Cash Flow Dashboards
Cash flow dashboards can be tailored to meet the specific needs of a business, with different types of dashboards serving various cash management goals. Whether tracking daily cash balances or analyzing expenses, these dashboards offer targeted insights that help finance teams manage cash flow effectively.
Daily Cash Position Dashboard: Displays daily cash balances to provide an up-to-the-minute view of liquidity.
Weekly Cash Flow Forecast Dashboard: Projects cash inflows and outflows for the upcoming week to support short-term planning.
Expense Monitoring Dashboard: Tracks business expenses by category, highlighting areas for potential cost-saving.
Revenue Tracking Dashboard: Focuses on revenue streams, showing income sources and seasonal trends.
Multi-Account Cash Flow Dashboard: Consolidates data from multiple accounts to provide a unified view of overall cash flow.
Key Challenges of Cash Flow Dashboards
Despite their many benefits, cash flow dashboards come with challenges that must be managed to ensure their effectiveness. From integrating diverse data sources to maintaining data accuracy, overcoming these hurdles is essential for creating a reliable and actionable dashboard.
Data Integration: Pulling data from various sources can be complex, especially for larger organizations.
Accuracy of Real-Time Data: Ensuring that data is current requires robust system integration and reliable updates.
Customizability: Building a dashboard that meets unique business needs may require specific configurations or tools.
User Training: Employees may need training to fully leverage the dashboard’s features and interpret its metrics.
Initial Setup Costs: Investing in dashboard software or technology may have upfront costs that require careful consideration.
Addressing these challenges can help finance teams maximize the value of their cash flow dashboards.
Best Practices for Cash Flow Dashboards
To make the most out of a cash flow dashboard, following established best practices can ensure accuracy, relevance, and ease of use. These practices promote effective implementation and use, enabling finance teams to maximize the dashboard’s potential for supporting financial stability.
Regularly Update Data Sources: Ensure all integrated systems are regularly updated to maintain data accuracy.
Customize to Business Needs: Tailor dashboard metrics to reflect the company’s specific cash flow requirements and goals.
Set Alerts for Key Events: Use automated alerts to notify the team of low balances, high expenses, or other critical events.
Prioritize User Training: Invest in training to help users understand and utilize dashboard functions effectively.
Review and Refine Periodically: Periodically assess the dashboard’s performance and make adjustments as the business evolves.
By following these best practices, companies can leverage cash flow dashboards as powerful tools for financial stability and growth.
What is Free Cash Flow?
Cash flow is the lifeblood of a business, but it's a mistake to look at this metric in blanket terms. Free cash flow measures the amount of cash on hand after removing capital expenditures. Said differently, this metric measures how much cash is actually on hand, meaning how much companies could access immediately if necessary.
How Do You Calculate Free Cash Flow?
Calculate free cash flow by subtracting capital expenditures from the cash flow from operations. Traditionally, metrics come from the cash flow statement, which makes the information easy to find, but also creates the risk of outdated insights. In practice, the hard part isn't calculating free cash flow; it's updating the underlying data so that the metrics reflect the current conditions.
What Does Free Cash Flow Indicate?
Companies with abundant free cash flow have money on hand to expand operations, invest in R&D, reduce debt, buy stock, or pay dividends. Essentially, they have money to use strategically. Plus, since free cash flow is driven by operating revenues, when this metric is high it suggests that companies are selling successfully. On the other end of the spectrum, inconsistent or insufficient free cash flow leaves companies with few options for addressing problems or building growth.
Where Do Dashboards Fit In?
When the CFO and other decision makers aren't updated about free cash flow on a daily basis, it leaves them with a huge blind spot in terms of enterprise performance. Unfortunately, manually tracking the underlying data is cumbersome at best and impossible at worst. This is why many companies update this metric occasionally instead of constantly.
Dashboards enable you to refresh data as often as you need. They automatically integrate and analyze enterprise performance data, then deliver real-time updates right to your screen. That way, the free cash flow metric is always accurate and constantly up to date, providing the most current information at a glance.
To fully appreciate what dashboards can do, you need to interact with one hands-on. They're more accessible than people expect, and more instructive too. Far from being mere data trackers, they're actually sophisticated decision-making tools that have a remarkable ability to highlight important insights. Discover the power of dashboards for yourself by exploring this downloadable free cash flow dashboard.