


95%
User adoption rate with Excel UX

A true spreadsheet experience inside Power BI with pivot tables, formulas, cell editing, and familiar formatting means zero learning curve and immediate productivity for Excel users.











Enter data, edit values, copy-paste between cells—exactly like Excel. Power ON adds a spreadsheet grid interface to Power BI that responds to all the keyboard shortcuts and mouse interactions your team already knows. No more exporting to Excel just to make changes.
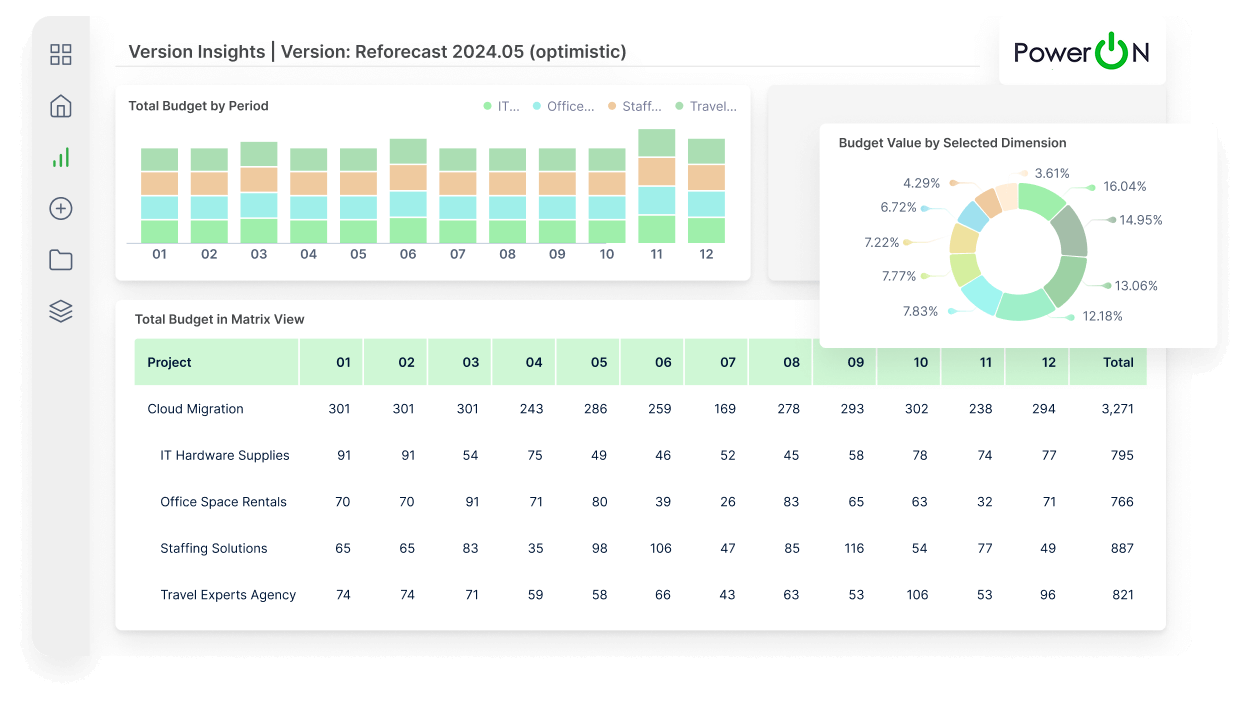
Analyze data with drag-and-drop pivot functionality right inside Power BI. Slice, dice, and summarize your data the way Excel users have done for decades—but now with the power of your entire enterprise data model behind it. Real pivot tables, not just static visuals.
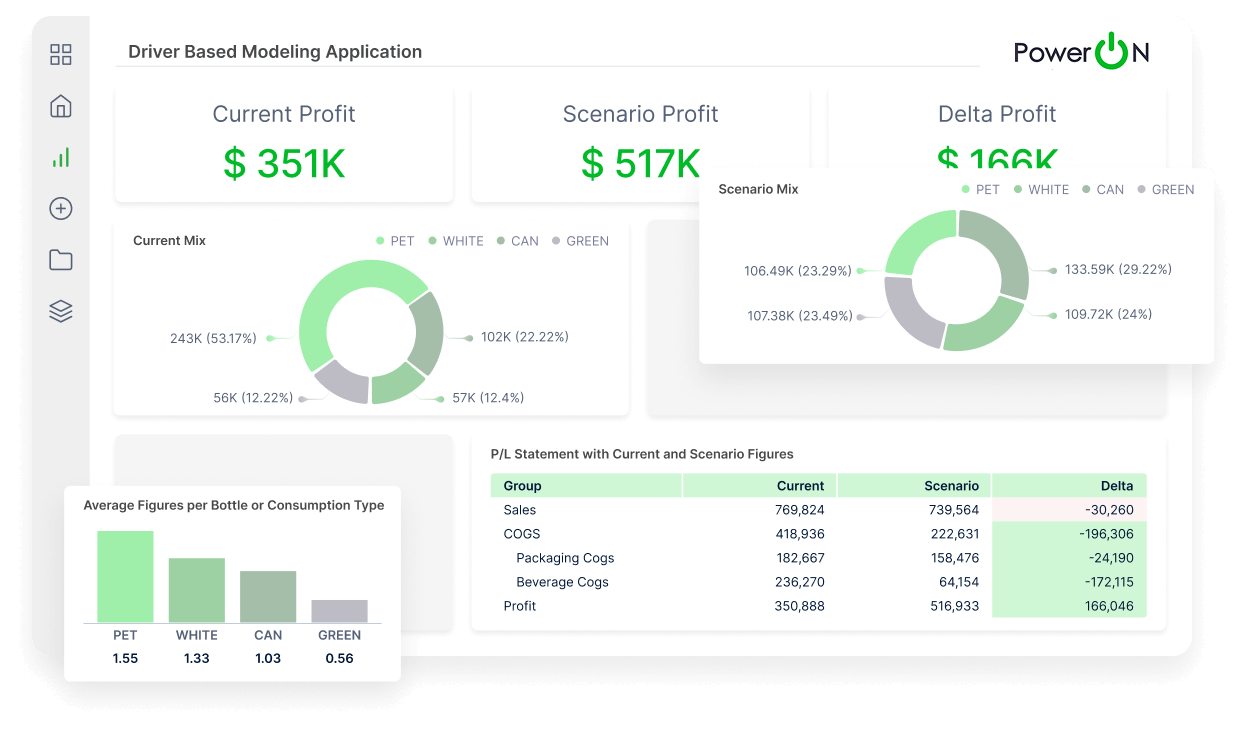
The biggest barrier to BI adoption is learning new tools. Power ON eliminates this by giving users an interface they've used their entire careers. Finance teams, operations managers, and analysts start being productive on day one—no extensive training required.
95%
User adoption rate with Excel UX
0Days
Training time for Excel users
1Tool
Instead of Excel + Power BI
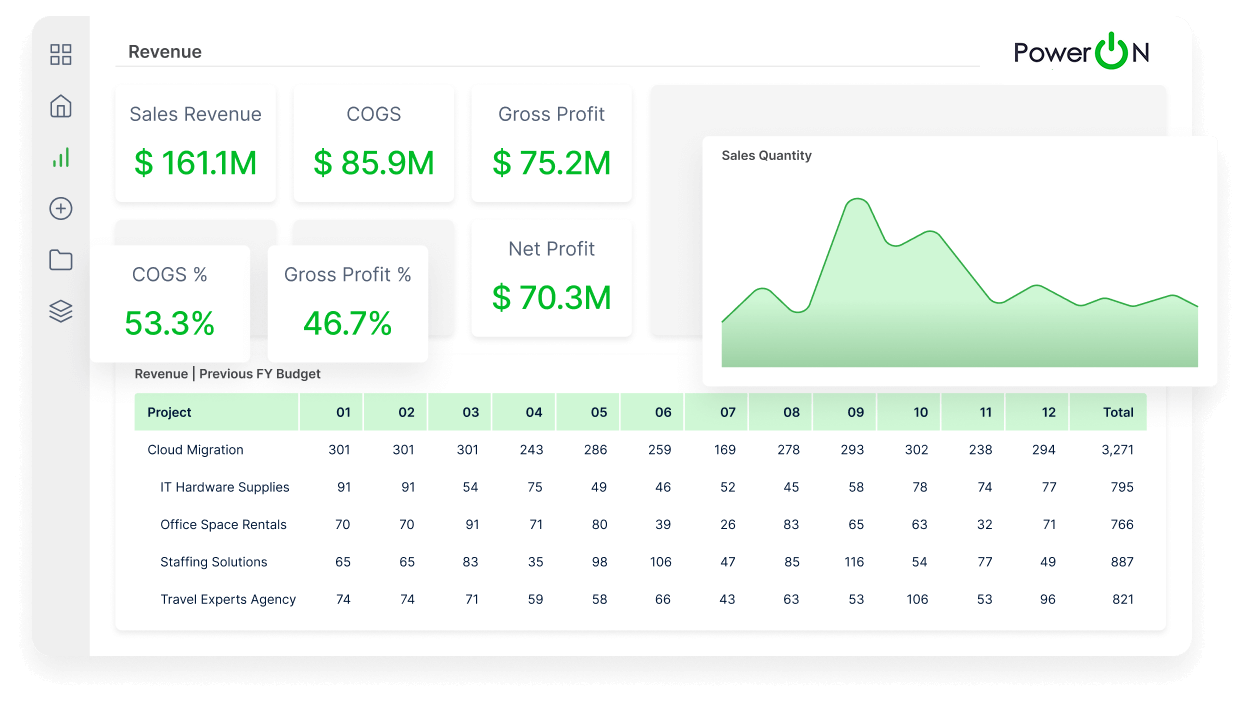
Stop switching between Excel and Power BI. Power ON brings the spreadsheet experience directly into your BI environment so teams work faster and data stays consistent.
Cell editing
Copy-paste support
Pivot table views
Column formatting
Filter & sort
Keyboard shortcuts
Formula support
Multi-select editing
Conditional formatting

