Logi Symphony Report


Custom Web-Based Reports With Modern Visual Analytics
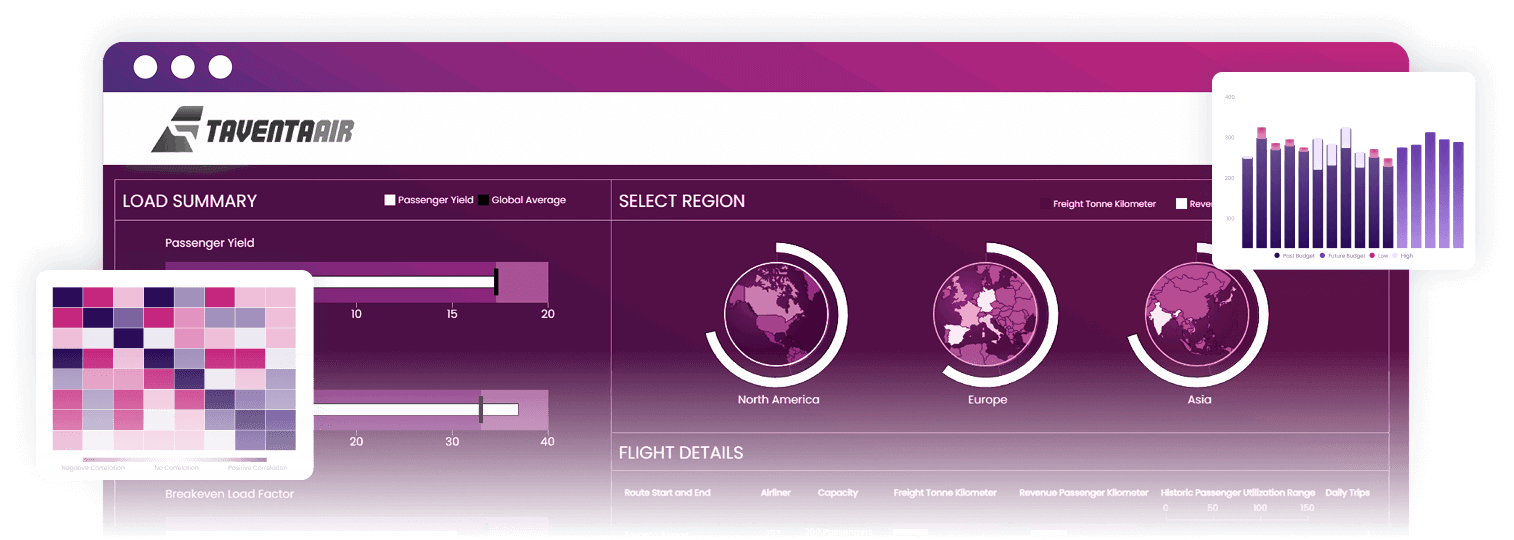
Build custom web-based reports with interactive visuals and an extensive visualization library. Unified reporting and analytics with linked, drillable content.


Is Your Reporting Software Outdated, Inefficient & Lacking?
Using an Outdated Application for Reporting?
Many organizations use outdated reporting tools that lack modern features and flexibility. These tools hamper the ability to meet evolving business needs, poor data insights, and an inevitable need for rework as these legacy tools near end-of-life.

Is Report Building Cumbersome and Inflexible?
Traditional report building can be slow and rigid, making customization difficult and a drain on your team. Users often face challenges adapting reports to specific needs, resulting in a lack of tailored insights and increased time spent on manual adjustments.
Are Your BI and Reporting Separate Applications?
Using separate tools for BI and reporting can create a steep learning curve and a disjointed user experience, especially when embedding. This separation often doubles the data work, complicates integration, and leads to a generally poor user experience.
Use Cases
Comprehensive BI & Reporting in One Unified Platform
One-Stop Full-Stack Reporting, Unbounded and Without Limits
Logi Symphony offers comprehensive embeddable reporting capabilities, allowing seamless integration of reports into your applications. This full-stack solution supports a wide range of data sources, providing robust data visualization, real-time analytics, and customizable reporting features, all in one platform.
300%
Increase in productivity
2,000
Hours of work saved each year
75%
Reduction in development time
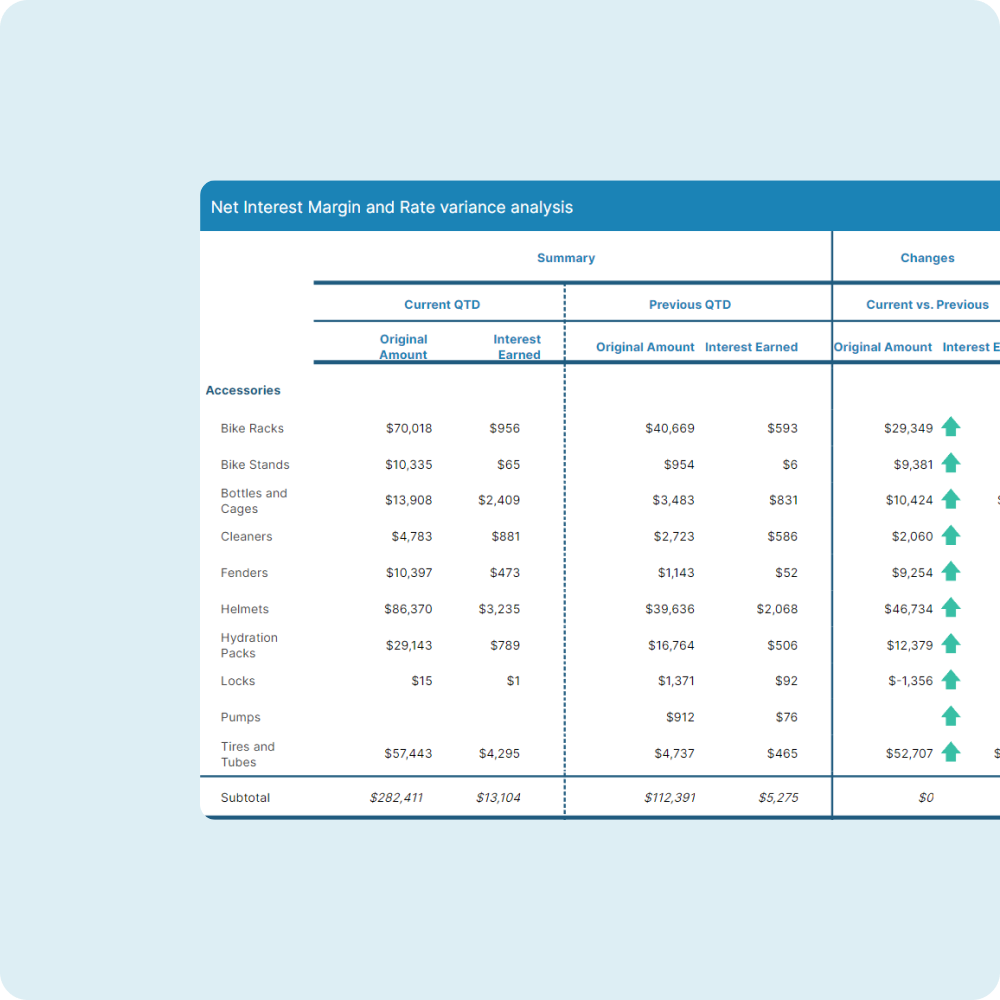
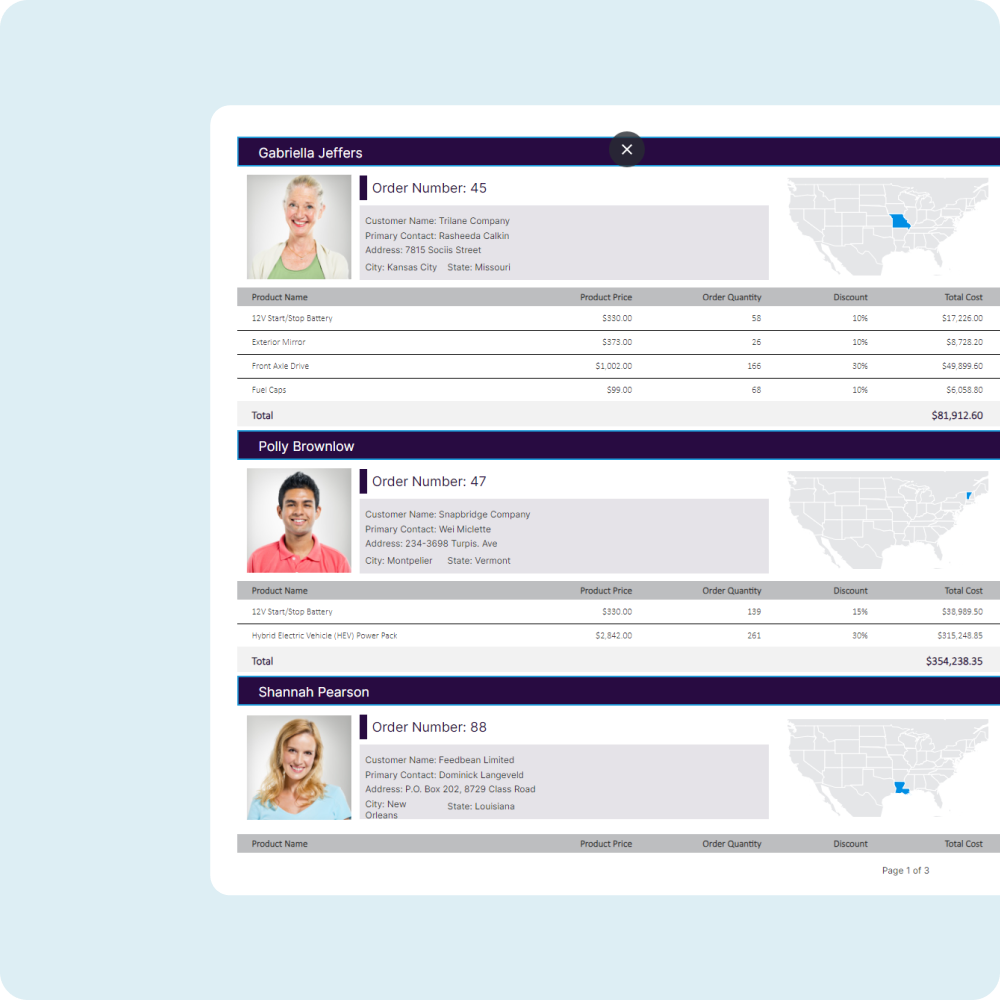
Your Reports, Your Way with Precision-Pixel Perfect Detail
Achieve perfect precision with Logi Symphony's Pixel-Perfect Reporting. Design reports with exact control over layout and branding. Unlike most reporting vendors, we support complex data visualizations, advanced formatting, and dynamic content customization, ideal for detailed, high-quality reports.
300%
Increase in productivity
2,000
Hours of work saved each year
75%
Reduction in development time
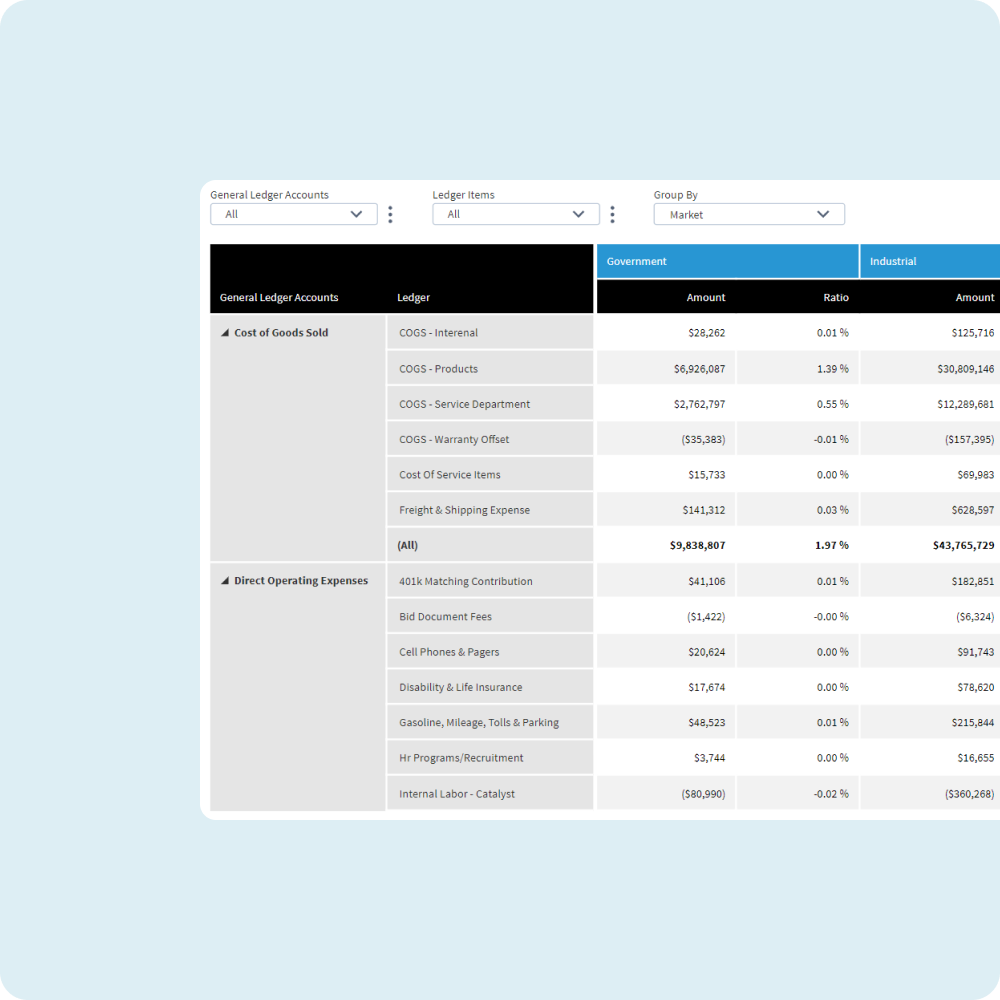
All-in-One BI & Reporting, Unified for Efficiency
Logi Symphony unifies business intelligence and reporting into a single, powerful application. This integration eliminates the need for separate tools, streamlining workflows and reducing data redundancy. Users benefit from consistent data insights and an enhanced user experience, all within a cohesive platform.
300%
Increase in productivity
2,000
Hours of work saved each year
75%
Reduction in development time
Discover Logi Symphony’s Reporting Capabilities
Advanced Visual Reporting
Create tailored reports with optional advanced interactivity
Include charts, graphics, and a full suite of data visualization options
Precise control over layout, structure, fonts, and styles
Meet specific output requirements and regulations
Scheduled Reports & PDF Generation
Automate the generation and distribution of reports
Export reports in PDF format for easy sharing or storage
Export printable reports with a clickable table of contents

Data Modeling & Performance
Advanced data modeling capabilities for complex datasets
Optimize performance with our patented in-memory data cube engine
Warehouse for performance or view reports in real time
Self-Service Reporting
Empower users with tools for creating and customizing reports
Easy-to-use interfaces for non-technical users
Reduce dependency on IT with robust self-service capabilities
Embedding & Customization
Iframeless embedded reports for seamless integration
Support for single sign-on authentication
Whitelabeling for consistent branding and user experience

Security & Compliance
Built-in tools for data governance
Ensure compliance with industry standards
Secure data access and user authentication
Want to learn more? Watch our webinar!
Join our educational webinar to learn how Logi Symphony enables the creation of high-precision, pixel-perfect reports. Discover how to format and brand reports, reuse components, and follow best practices. Empower your team to make data-driven decisions.